Contributors: Andrew Webb, Principal advisor, England Peat Map. Tom Hunt, Data engagement lead, England Peat Map. Sarah Parrott, Engagement and impact lead advisor, NCEA. Elizabeth Mitchell, Engagement and impact senior advisor, NCEA
How do you make a map of something that’s largely underground, changes in volume depending whether it’s rained recently, and tries to swallow you up every time you set foot in it?
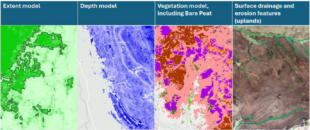
We’re talking, of course, about peat. The England Peat Map, due for publication in March 2025, will be the most complete map of England’s peatlands and peaty soils to date. It will model the extent, depth, and condition of our peat, including vegetation and surface features like grips and gullies (manmade and natural drainage channels). The map will be open access.
You probably know by now how important our peatlands and peaty soils are. They provide habitat for many of our most charismatic plants and animals, water storage and purification on a massive scale, and our biggest single store of carbon. They’re also magical places to visit, and there are plenty of ways of doing so while still keeping your feet dry! Mapping peat is essential to understanding what benefits it provides to us, and what we need to do to secure this flow of benefits (closely linked to the flow of boggy peatland streams) into the future.
29 different peat maps?
The England Peat Map is led by Natural England and funded by Defra’s Natural Capital and Ecosystem Assessment and the Nature for Climate fund. But Natural England isn’t making the England Peat Map alone, and we didn’t start from scratch – the map is a major collaborative effort. A huge amount of peatland data existed before this project, but it was held by lots of small or regional based projects. It had many owners, who used different data collection methods and licence agreements. The data mainly consisted of highly detailed surveys of individual sites, which would be too expensive to replicate on a national scale. All this made it difficult to see the bigger picture of the state of England’s peatlands.
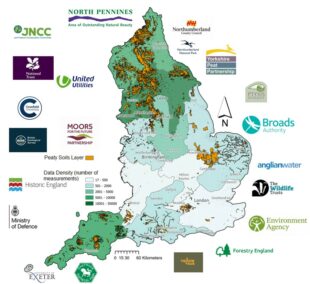
A big part of our work has therefore been to work with 29 partner organisations – ranging from national to local, and from public to private and non-profit sectors – to assemble existing peat maps and data.
For example, the Great North Bog has provided us with a wealth of data for northern England’s moorlands. Great North Bog unites the peat partnerships for Yorkshire, Lancashire, North Pennines National Landscape, Northumberland and Cumbria, as well as Moors for the Future (covering the Peak District and the South Pennines). Between them these areas are home to 96% of England’s upland peat, and have contributed over 1,500 datasets to the peat map.
Lowland peat
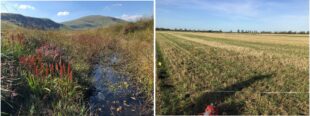
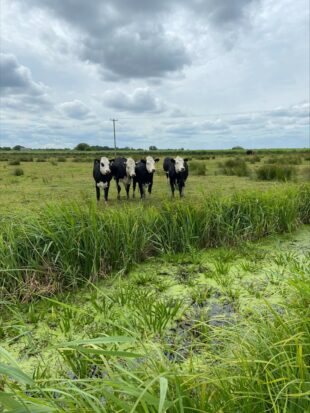
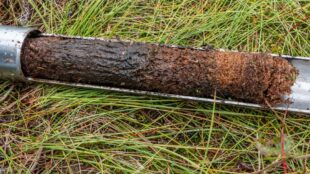
Some of our biggest challenges are around lowland peat. Peatlands can occur anywhere that has been wet at any time in the last 10,000 years. In the lowlands you can find peat in a farmer's field, in woodlands or grasslands, sometimes in the most unlikely of locations. Lowland peat can be 3-4 times deeper than upland peat, making it an incredibly important store of carbon. However, it can be much harder to find as it can occur almost anywhere!
Combining technologies
It would be incredibly time-consuming and expensive to survey the extent, depth and condition of every peat deposit in the country, so the final map will be a modelled one. This is our best prediction of where peat could be, based on a range of evidence, rather than a perfect documentation of its exact locations.
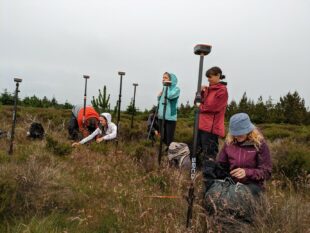
To create national-scale maps, we train algorithms on field survey data (some from our partners, supplemented by more of our own), along with satellite data from the European Space Agency and other national datasets. We use these models to identify the likelihood of peaty soil presence, its depth, and associated vegetation. Field data lets us check the accuracy of the AI, allowing us to improve the models and make more confident predictions going forward. Using models like this means that we can make predictions of the likelihood of peat presence even where very little data is available.
We’re also using AI to predict the location of surface features like grips and gullies. These features are indicators of poor peatland condition and mapping them is an important step when planning restoration projects. The AI4Peat team, a separate cross-government initiative managed by Natural England, are leading this work, which will be integrated into the published England Peat Map.
Who benefits?
We’re immensely grateful to everyone who’s contributed to the England Peat Map so far, and proud of the map which is emerging from so much collective effort. We hope that the organisations which have supplied data will be among the main beneficiaries, and that they will be able to use the map to plan for the conservation and restoration of the peatlands in their care.
But even those of us who’ve never knowingly seen peat in our lives have something to gain, as the map supports a variety of schemes and commitments which benefit us all. These include:
- Net Zero
- England Peat Action Plan
- 25-Year Environment Plan and Environmental Improvement Plan
- Environmental Land Management Schemes
- Nature for Climate Peatland Grant Scheme
- Nature recovery
Among many other uses of the map, knowing how much peat we have is the first step to calculating how much carbon it holds and how much it’s releasing – vital information as we work together to combat climate change.
Give peat a chance (sorry!)
So: put March 2025 in your diary, and look after your peatlands till then – they can get smaller pretty quickly, but it takes a long time to replenish degraded peat. Remember, history may re-Peat itself, but only at a rate of about 1mm a year…
We are grateful to the following partners for contributing data to the map:
Anglian Water
Cranfield University
Cumbria Wildlife Trust
Dartmoor National Trust
British Geological Society
Broads Authority
Environment Agency
Forestry Commission
Historic England
JNCC
Lancashire, Manchester and North Merseyside Wildlife Trust
Lincolnshire Wildlife Trust
Ministry of Defence
Moors for the Future Partnership
National Trust
North Penines AONB
Northumberland County Council
Northumberland National Park
PTYXIS Ecology
RSPB
Somerset Wildlife Trust
South West Water
Surrey Wildlife Trust
United Utilities
University of Exeter
University of Leeds
University of Southampton
Yellow Sub Group
Yorkshire Peat Partnership
2 comments
Comment by J. Janman posted on
would have been useful to have a weblink to the actual map in the blog so people could use it.
Comment by Natural England posted on
Thank you for your comment. We can’t share a link as the map isn’t yet published, but we’ll do so as soon as we can – planned publication is for March 2025