By Dr Ruth Waters, Director for Evidence, Natural England, and David Jones, Senior Responsible Officer for the Natural Capital and Ecosystem Assessment, Defra
England’s peat deposits are one of our most valuable national assets. They’re our largest carbon store, they filter most of our fresh water and help defend communities against flooding, and they’re home to irreplaceable plants and wildlife.
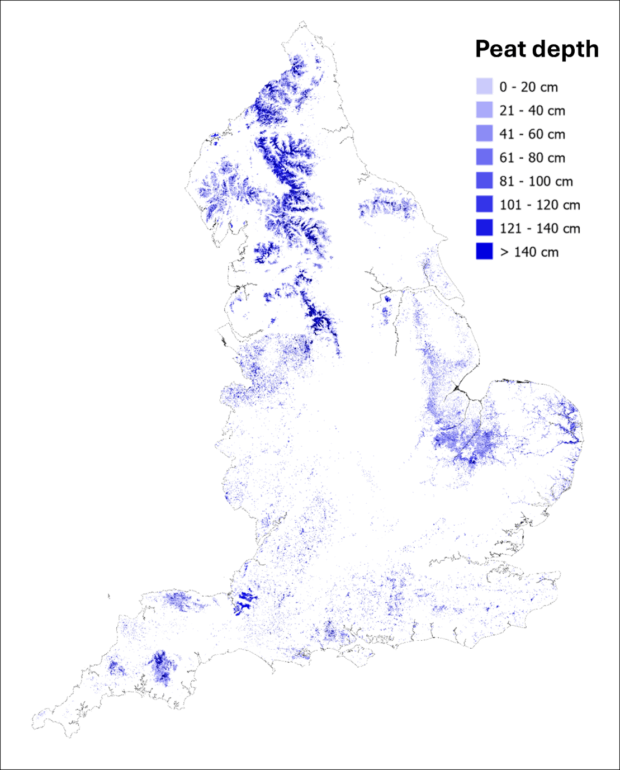
But what you can’t measure, you can’t manage. Today Natural England launched a new nationwide map of peat and peaty soils, The England Peat Map. The map has the most detailed national coverage to date for peat depth, peatland vegetation, upland drainage channels, and upland bare peat, which are all important in determining peatland condition. It’s published on an open access, easy to use web viewer and across a number of freely accessible government platforms.
This new peat map marks a step change in our ability to make national, regional, and local scale plans for England’s peatlands and peaty soils. It will be a key resource for government, for conservation organisations, and for anyone else working on the large-scale restoration of peatlands or the ecosystem services they provide. The map has been produced by the Natural Capital and Ecosystem Assessment programme as part of a nationwide survey of our land, freshwater and coastal ecosystems to produce a baseline of our natural assets.
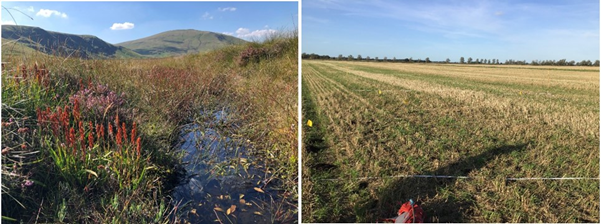
We already know that many of our peatlands are in a poor condition, but limited data has made it hard to build a detailed picture of what is happening across England. The new England Peat Map allows us to see that around three quarters of our peatlands are covered by plants and land use types associated with drier conditions, such as arable and horticultural land, bare peat, broadleaved woodlands, or near or within built-up areas and gardens, rather than the wetland plants we’d expect on healthy peatland. At least 37% is dominated by heather, which flourishes under dry conditions, while just 1% is dominated by Sphagnum mosses – a key peat-forming plant group associated with wetlands. The map also shows the locations of many thousands of drainage channels, which are often closely connected to dried-out, deteriorating peatlands. Taken together, the data provides the most detailed understanding of peatland extent and features ever available at an England-wide scale.
How will the map be used?
- It will help us calculate peatland greenhouse gas emissions more accurately. Emissions from degraded peat soils are currently estimated at about 2% of England’s total, and 3.5% of the UK total.
- It will improve our understanding of peatland condition and help us to plan conservation. According to the International Union for Conservation of Nature (IUCN), 80% of the UK's peatlands are currently degraded, making this an area in need of urgent action.1
- Better data allows us to make more informed decisions about how to manage our landscapes, such as for water security and food security. Peat-dominated upland landscapes filter most of the UK’s drinking water, while the fertile Fenland soils in East Anglia are vital both for farming and as a store of buried carbon.
- The map will support Defra commitments on cleaning up our freshwater assets, turbocharging nature’s recovery and protecting communities from flooding. Peatlands play a critical role in environmental services by absorbing and cleaning our water, capturing carbon and providing a home to a wide range of specialised, rare and threatened species.
- While the map has not been specifically designed to inform Defra’s consultation on heather and grass burning on moorland in England, open until 25 May, it may be of interest to those wanting to input into the consultation.
How is the map made?
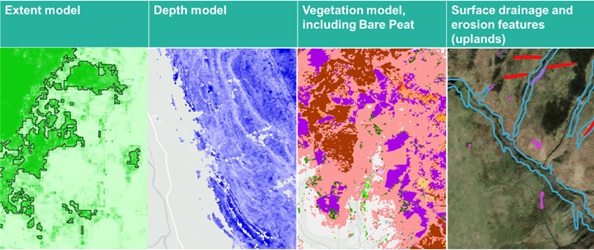
The map relies on the integration of AI techniques with other survey methods. It uses satellite imagery, pre-existing peat survey data, new field survey data, and data on geology, topography (LiDAR), and historic land use. These are then analysed using AI algorithms (machine learning and deep learning). Using these algorithms we have, without needing to visit sites in person, predicted where peat will be found and identified drainage channels right across upland peat landscapes.
Without needing to manually survey every peat deposit in the country, the England Peat Map combines modelling and real-world data to give our best prediction of where peat is. Our models are trained on over 300,000 data points from field surveys. They have an overall accuracy measure of over 95% for the extent of peaty soils and 94% for vegetation and land cover. As a national-scale map it will be a vital part of the decision-making toolkit for local scale management, though needs to be used in conjunction with local evidence for site-level decisions.
The most difficult areas to map have been in the lowlands, where survey data is harder to gather and where more peat has been modified through historic intensive agricultural use. Drained lowland agricultural peat soils are responsible for the vast majority of greenhouse gas emissions from England’s peat, so improving mapping of these areas will be an important area of work for the future.
Technical documentation and datasets can be downloaded from the project website, from Defra’s Science Search platform, and from Natural England’s Access to Evidence page. The map can also be accessed from Defra's Data Services Platform (DSP).
Funding and partners
The map has been made by Natural England and is funded by Defra’s Natural Capital and Ecosystem Assessment (NCEA) programme and Nature for Climate Fund (NCF). However, it’s also a triumph of teamwork between the public, non-profit, and private sectors. Natural England wouldn’t have been able to make the England Peat Map without generous contributions of data from 29 partner organisations – ranging from the National Trust and the Great North Bog partnership to Anglian Water. Together we’ve moved from a fragmented, localised picture of England’s peatlands to a joined-up, national one.
The natural capital value of peatlands
England’s peatlands and peaty soils are among our most valuable natural capital resources. New peat only forms at a rate of about 1mm a year, so by far the best way of ensuring that we continue to receive its benefits is by not letting it degrade in the first place and restoring damaged peatlands. Figures from the Office for National Statistics indicate that our peatlands’ value as a source of drinking water is worth many hundreds of millions, while our 180 million hours of recreational visits to them were worth £274 million. But all this is dwarfed by their value as a carbon store. The value of reduced carbon emissions from restoring all peatlands in the UK would be between 5 and 10 times the cost of restoration. At a conservative estimate, restoring 55% of peatlands to near-natural condition would have a value of around £50 billion. In allowing us to measure how much peat we have in locations across England, and the features of our peatland landscapes, the England Peat Map will give decision makers vital information to help them make the right choices for these irreplaceable national assets.
Natural England’s Chief Scientist Dr Sallie Bailey has said of the map:
“Trying to map something that’s largely underground, changes in volume depending whether it’s rained recently, and tries to swallow you up every time you set foot in it comes with its challenges, which makes this map extraordinary in its accomplishment and something of a global first.
“Mapping peat to this level of detail will help us maximise the benefits of peat and massively advances our understanding the role our peatlands are playing in a changing climate.”
Natural England’s Chair Tony Juniper said of the map:
“The urgent need to improve the condition of our peatlands is well documented. They provide irreplaceable benefits as our biggest natural carbon stores, regulators of water quality and flood risk, and through the habitats they offer for plants and animals.
It is only with the support of detailed evidence and mapping that we can understand the health of these ecosystems and turn this into effective conservation action.
The England Peat Map will help us understand their contribution to our greenhouse gas emissions, target restoration efforts to the most degraded land, and identify some of the best opportunities for nature recovery. This will underpin better decisions affecting peatlands for many years to come.”
Nature Minister Mary Creagh said:
“Our peatlands are this country’s Amazon Rainforest and in desperate need of restoration and protection, as this mapping and research work starkly demonstrates.
“That is why we have announced up to £400m for nature restoration, including of our peatlands, and are consulting on new plans to extend the ban on burning deep peat. This government, as part of our Plan for Change, are committed to expanding nature-rich habitats and turning the tide on nature’s decline after years of neglect.”
Caroline Thorogood, the National Trust's national lead for peatlands, has said of the map:
"We’re excited to see the launch of the England Peat Map. The data in the map will help us take a significant step forward to more accurately map peatlands that we own and care for in England and understand their condition. This will allow us to better identify priorities and action future work to recover our precious peatlands, helping nature thrive and providing benefits such as carbon storage and water regulation."
- Edited to reflect that the statistic is for the UK, not England, and to cite the source. ↩︎
28 comments
Comment by Mrs L M A Hodges posted on
Following my degree in Botany & Geography at University of Manchester in the 1970s, for which we looked at peat cores, and studied peat formation & degradation, no-one wanted to talk about peat when I left. Delighted to see Natural England producing the new Peat Map and weĺl done to all those who worked on it from researchers to cartographers. Please produce good quality A5 postcards & usual sizes teatowels for us to buy!
Comment by EB posted on
Hi Mrs Hodges,
The postcards and tea towels are a great idea! I think most people haven't heard of peat before let alone what ecosystem services it provides. I worked to gather data for the England Peat Map and it took me to some fab places. If you've not already you might like to visit a peatland that has had some restoration so you can see what is done.
I won't say that the economics of peatland restoration speak for themselves, because I think we need to speak of them more. Great to see them feature in this article and link it to the 'up to £400 billion for nature restoration' investment. Hopefully that stretches a long way!
Comment by Mark Sanders posted on
Having just checked our own farm, a significant area is included on the Peat Map, the vast majority of which is improved grassland with NO peat soils at all. If that degree of inaccuracy is indicative of mapping accuracy as a whole then the Peat Map will lead to a range of anomalous decisions that could be significant and costly to correct at individual farm level. If this is the level of accuracy (inaccuracy) that is going to inform future land use restrictions and changes then Heaven help all of us trying to make well-informed day to day farming decisions. Please can you advise and publicise what the process is for challenging and correcting the map data.
Comment by C frampton posted on
Same for us.
We have degraded peat mapped on steep acidic grassland and the maps line up a little too closely to the woodland inventory maps for it to be coincidence. All our ‘degraded peat’ are trees and rocks in real life.
It’s not a good map at all.
Comment by Carol Cooke posted on
As a casual observer who tries to buy peat free compost I have read the comments and am not a lot wiser regarding which land this covers.
Comment by Tim Martyn posted on
As an agronomist (ex-IGER research scientist) I too have noticed inaccuracies on farms of my clients in my area of West Devon: fields claimed to be peat of over 1m depth when they are a stagnogley mineral soil. So much for technology! Did anyone bother to corroborate the peat map with the SSEW 10km square mapping?
Comment by Tim Martyn posted on
I accept that there is not 100% accuracy in the system, but this is recorded as an isolated outlying area of peat of significiant depth in an area where peat is rarely found. In conversation with the farmer it has been determined that the field had been covered in slurry prior to ploughing recently. It is probable that the GIS system used to identify the field as being peat picked up on the dark black colour of the field covered in slurry on a single occasion. This may be a common error repeated across the mapped area.
Comment by Natural England posted on
Thank you for getting in touch Mark, and we’re sorry to hear that the peat map appears to be incorrect for your land.
This is a significant new dataset, and while robust, it won’t show 100% of England’s peat. While the models are the most accurate picture of England peat resources to date, some areas of peat will have been missed, and there will be places where the map predicts peat but where it may not actually occur. As we say in the blogpost, our models have an overall accuracy measure of over 95% for the extent of peaty soils, and of 94% for vegetation and land cover. Levels of accuracy are described and explained in the final report and the accompanying user guide.
It's also important to emphasise that as a predictive model, the England Peat Map should not be used as a stand-alone justification for action at a given site. It is not a regulatory mechanism and wouldn't be used by itself without first-hand verification of the situation on site.
While the map may have local uses, it is also designed to be a national tool, which will give us a detailed (if not perfect) overview of the location and features of peat across the country. This information will help government and others to make decisions at landscape, regional, and national scales about how to manage our peatlands and peaty soils.
The process for updating and improving the map is in development but will include the opportunity to provide new peat survey data. If you have new peat survey data you believe we could incorporate into the map to improve its accuracy, please email us at peatmap@naturalengland.org.uk.
We would like new survey data to conform with this draft standard.
Comment by Cat Frampton posted on
Haytor, the iconic Devon landmark known for being a very large and imposing lump of granite, is shown as being deep peat. (87cm on its top)
It looks like all the tors of Dartmoor are similarly miss diagnosed.
The vegetation mapping is wildly different from magic (which has its own inaccuracies) and is wrong in many places, (woods are not grassland) but the degraded peat layer matches the tree inventory in many places like a glove.
I am sorry but the map is not fit for purpose. Any conclusions drawn from its data will be unusable.
Comment by Imogen Turner posted on
Brilliant to see this. I was wondering if the same is due to be replicated for Scotland, Wales, and N. Ireland? If so, would you know the timeline for completion?
Comment by Natural England posted on
Environment is a devolved matter. The devolved administrations across the UK have developed their own approaches to peat mapping using methods appropriate to their areas and using the data that has been collected there.
In Scotland, Scottish Nature Heritage published the Carbon and Peatland map in 2016:
https://opendata.nature.scot
https://www.nature.scot/climate-change/nature-based-solutions/nature-based-solutions-practice/peatland-action/peatland-action-data-research-and-monitoring/peatland-action
In Wales, the Welsh Government published the Peatlands of Wales Maps in 2022:
https://datamap.gov.wales/maps/peatlands-of-wales-maps/
The most recent peat mapping work for Northern Ireland was completed in 1988 and can be found here: Priority Habitats - https://www.data.gov.uk/dataset/34e6b4fe-2872-4822-8969-e9a5a1367079/priorityhabitats_peatland
Comment by Simon Bates posted on
Disappointed to see that the accuracy in my part of Devon 5 km north east of Exeter is poor. For example, the lowland fen site of Hellings Parks, near Broadclyst (a County Wildlife Site) is not mapped at all. This is despite the fact that it is mapped on MAGIC as priority lowland fen. If there has been no interaction with local record centres (when a simple call for data on fen sites would have surely flagged this, and other sites), then that's a severe failure.
Comment by Natural England posted on
Hi Simon, we’re sorry to hear that the map appears to show inaccuracies for Hellings Park.
This is a significant new dataset, and while robust, it won’t show 100% of England’s peat. While the models are the most accurate picture of England peat resources to date, some areas of peat will have been missed, and there will be places where the map predicts peat but where it may not actually occur. As we say in the blogpost, our models have an overall accuracy measure of over 95% for the extent of peaty soils, and of 94% for vegetation and land cover. Levels of accuracy are described and explained in the final report and the accompanying user guide.
We are aware that local environmental records centres provide valuable sources of information and have incorporated local data where available. We are committed to making the England Peat map fully accessible, which may have restricted our use of some data sets which require subscription or payment for data. If you are aware of an area with peat, not covered by the map, please get in touch with us at peatmap@naturalengland.org.uk. We would like new survey data to conform with this draft standard.
It's also important to emphasise that as a predictive model, the England Peat Map should not be used as a stand-alone justification for action at a given site. It is not a regulatory mechanism and wouldn't be used by itself without first-hand verification of the situation on site.
While the map may have local uses, it is also designed to be a national tool, which will give us a detailed (if not perfect) overview of the location and features of peat across the country. This information will help government and others to make decisions at landscape, regional, and national scales about how to manage our peatlands and peaty soils.
Comment by John Miller posted on
On my hands and knees last week, examining a floral mix and abundance of cloudberry, blueberry, and bilberry, in a recently burnt/cut strip of heather - is this detail picked up by the imagery? Thanks
Comment by Natural England posted on
Lucky you getting out onto the moors at such a beautiful time of year!
The map has a 10m x 10m resolution, so doesn't show enough detail to pick out the blueberries within a strip of heather, but it does cover the main vegetation groups and land cover types associated with peatland, showing where each one is dominant. You can see the specific categories covered in the "vegetation and land cover" layer of the map, and see a detailed breakdown in the final report and user guide.
Comment by Ivan Le Fevre posted on
There is a policy tension here with the Government's ambition to see more on-shore windfarm development. Proposals such as the Calderdale Energy Park are in the pipeline (accepted as a National Infrastructure Project to be subject to Planning Act 2008 consent by the Secretary of State DESNZ). This proposal is on an area of deep peat, as identified by the map. Construction of massive foundations and associated roads, cable runs and assorted infrastructure will be unlikely to support restoration of these peatlands to good functional condition. Are Defra and Natural England in discussion with DESNZ to ensure peatlands are protected as we roll-out on-shore wind?
Comment by Mr miggins posted on
The best way to preserve the peat bogs
Is to get sheep off them ....
Comment by Hollie posted on
Excellent dataset! Will the data be made available in WMS format for use in GIS?
Comment by Toby posted on
Hollie - I think you can find the data here: https://england-peat-map-portal-ncea.hub.arcgis.com/
Comment by AJ posted on
Really impressive datasets, great work!
Comment by David Gerard posted on
Can you go into more specifics about the "AI" used, and how it was used?
Was it machine learning applied to a specific data set? Was generative AI used to create a map from data? What were the data set inputs? I would be most interested in specifics!
Comment by Natural England posted on
Hi David,
The main AI algorithms we used were eXtreme Gradient Boosting (an algorithm which creates decision trees using many variables) and semantic segmentation (an algorithm which assigns labels to image pixels). No generative AI was used. The methods and input datasets are described in full in our final report and a majority of our training and validation data is available for download.
The AI was used in conjunction with extensive ground survey data. The models used over 170,000 ground survey data points for peaty soil depth and extent, gathered from 29 partner organisations including peat partnerships like the Great North Bog as well as the National Trust, Wildlife Trusts, and many others. These were supplemented by over 21,000 new points from our own field survey using a careful sampling strategy. Additional ground survey data was used for the other models too, so that in total the project used around 300,000 ground survey data points.
https://publications.naturalengland.org.uk/publication/5075614867128320
Comment by Andy Gates posted on
Given all the feedback highlighting inaccuracy, what methods were used to "ground truth" this map? Please don't say you let the AI slop machine run unverified?
Comment by Natural England posted on
Hi Andy,
The models used over 170,000 ground survey data points for peaty soil depth and extent, gathered from 29 partner organisations including peat partnerships like the Great North Bog as well as the National Trust, Wildlife Trusts, and many others. These were supplemented by over 21,000 new points from our own field survey using a careful sampling strategy. A percentage of these were held back from the training process to be used for verification. Additional ground survey data was used for the other models too, so that in total the project used around 300,000 ground survey data points. More data is being sought to revise the models.
The main AI algorithms we used were eXtreme Gradient Boosting (an algorithm which creates decision trees using many variables) and semantic segmentation (an algorithm which assigns labels to image pixels). No generative AI was used.
You can find more information on both ground truthing and AI methods in the final report.
https://publications.naturalengland.org.uk/publication/5075614867128320
Comment by Richard Pedley posted on
Surely the simple thing to do would have been to assess the data collected from SFI MOR1.
Most Upland farms will have carried this action out and built up a pretty good and accurate picture of what is there for you, if you'd just use our information this is supposedly a public good after all!
Taxpayers ££££s has paid for this Peatland Map, which unfortunately looks a way off being accurate.
Surely it needs more work to get the accuracy of the map nearer to what it should actually be, because it does look rather unprofessional given the inaccuracies.
Comment by Natural England posted on
Hi Richard,
Thanks for your suggestion. Different sources of data will be continually sought and assessed for their suitability for training the models. In the specific case of Sustainable Farming Incentive MOR1, there isn't always a requirement for applicants to submit data, and this therefore may not be available to the project. This will be investigated further over the coming year.
Comment by Andreas Heinemeyer posted on
Having read and seen some assessments (comparisons) I have to say that whilst this map is "a significant new dataset" it is not robust (e.g., houses/water shown as bare peat; straight lines between peat depths, etc.). It is also not clear to me how it was validated and tested (claims of accuracy should be based on proper trials/assessments outside the training data set and should also state for what resolution/scale). A stratified design should have been used with split datasets (trained/tested), covering all major peat areas, aspects, slope, vegetation and bedrock aspects. I am unsure if this was done.
I also fear that the peat depth data used to train the model might have overestimated the 'true' peat depth. From experience I know that metal rods easily push into the soft layer underneath the peat. To assess this issue a robust comparison would be needed (validation against actual peat cores).
Comment by Natural England posted on
Hi Andreas,
The EPM models were all extensively validated as part of the modelling process. You can find lots of information about how we went about this in the Final Report https://publications.naturalengland.org.uk/publication/5075614867128320. Our report will also give you much more information about how we calculated accuracy metrics from the models. We are aware peat probing can be an inaccurate field measurement technique, and glad you agree. That’s why we’re planning to do some work next year to try and quantify the errors associated with this method, as there’s currently not much in published literature.